Root Cause Analysis using Ishikawa
All organisations face problems daily, and a significant portion of our time is spent addressing them. The ability to solve problems effectively is a vital skill across all areas of business.
Often, the same problems recur time and time again, and we find ourselves firefighting—responding to the issue without addressing its underlying causes. While this may feel productive in the moment, it’s ultimately a waste of time if the root cause remains unresolved. If we repeatedly fix the symptoms rather than the cause, the problem will continue to reappear.
Problem solving requires individuals to draw on their unique experiences and perspectives of the issue and this can bring a diverse range of viewpoints, competing theories about the true causes and the best course of action to resolve them. This is where effective collaboration is key since there can be multiple stakeholders all with differing levels of experience of the problem at hand. Collaboration is most effective when structured properly, too often, meetings devolve into heated debates, with louder voices dominating the conversation. This can skew the identification of the root cause and lead to ineffective solutions. It’s important that everyone’s viewpoint is heard, and that discussions are focused on the problem at hand, not on personal biases or conflicts.
Understanding Ishikawa Problem Solving: A Comprehensive Guide
In the world of problem-solving, finding the root cause is often more important than just fixing the symptoms. While sticking plaster solutions may offer short-term relief, they rarely lead to long-term success. The Ishikawa problem-solving method, also known as the Fishbone Diagram or Cause-and-Effect Diagram, is a structured approach for identifying and analysing the root causes of a problem. This powerful tool helps teams dig deeper into problems and uncover the true causes that need to be addressed for lasting improvement.
Developed by Japanese quality control expert Kaoru Ishikawa in the 1960s, this technique has become a staple in industries ranging from manufacturing to healthcare, and is widely used in continuous improvement methodologies like Six Sigma and Lean.
In this article, we will delve into the core principles of the Ishikawa problem-solving method, how to apply it, and why it remains a powerful tool in quality management today.
What is the Ishikawa Diagram?
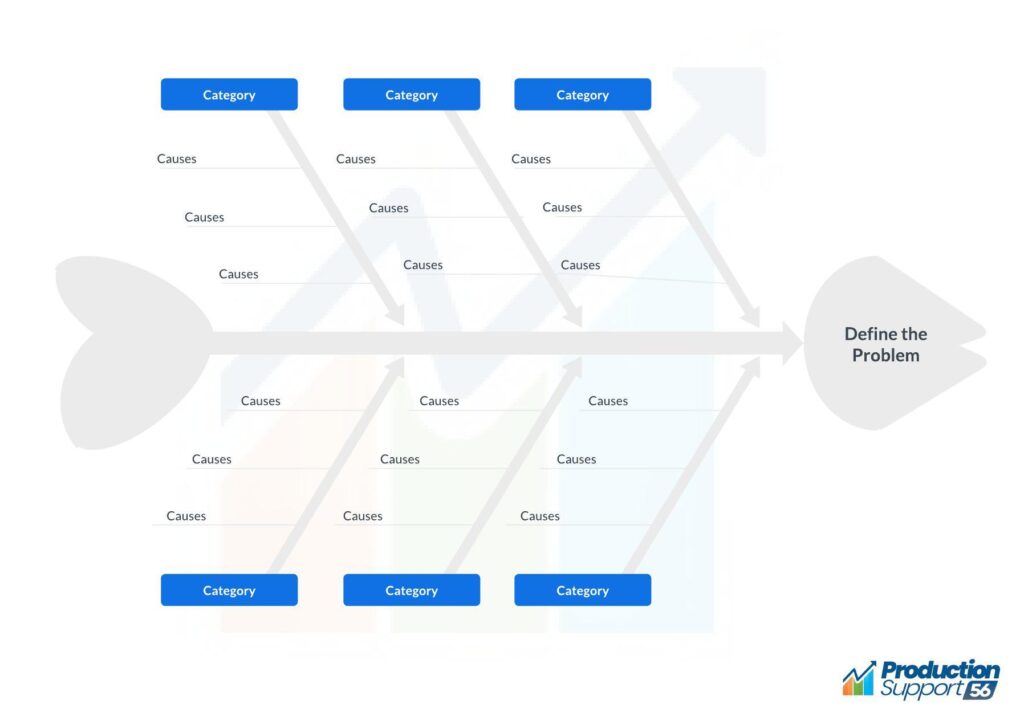
It’s a visual tool that helps teams identify, explore, and categorise the potential causes of a specific problem. The diagram looks like a fish skeleton (hence the name “fishbone”), where the problem is at the “head” of the fish, and the possible causes are represented as “bones” branching out from the spine.
Each bone in the diagram represents a category of potential causes, and further sub-causes can branch out from them. The goal is to trace all possible factors that could be contributing to an issue, allowing teams to identify the root causes systematically.
The key idea behind the Ishikawa method is simple: instead of jumping straight to conclusions, take the time to investigate all potential causes that might be contributing to the issue. By organising these causes systematically, you’re able to pinpoint the root cause(s) that need to be addressed for effective problem resolution.
Key Components of the Ishikawa Diagram
1. The Problem (Head of the Fish): This is where you clearly define the problem you’re trying to solve. It’s placed at the head or far-right end of the diagram. Being specific about the problem is crucial—don’t just say “quality issues” or “delays,” but rather “delays in shipment” or “defects in finished product.”
A problem well-stated is a problem half-solved
Charles Keating, the Ford Motor Company.
2. Main Categories (The Big Bones): These are the broad categories that might contribute to the problem. Ishikawa originally proposed six categories, but they can be adjusted depending on the nature of the issue. The traditional categories are:
- People: Human-related causes, such as lack of training, human error, or miscommunication.
- Machine (Equipment): Mechanical issues, tools, or technology failures. including malfunctions, outdated machinery, or poor maintenance.
- Material: Raw materials or supplies that may be substandard or poorly managed.
- Method: Issues in processes or procedures, such as inefficiencies, outdated methods, or lack of standardisation.
- Measurement: Problems with how performance is measured or tracked, such as incorrect data, poor metrics, or inconsistent reporting.
- Environment: External factors that might be affecting the problem, such as workplace conditions, regulatory changes, or environmental factors (e.g., weather, power outages).
3. Sub-Causes (Smaller Bones): Beneath each main category, smaller branches represent specific causes or factors. For example, under “Machine,” you might have sub-causes such as “Outdated software,” “Malfunctioning parts,” or “Lack of regular maintenance.”
4. Root Causes: Through analysis, the team works their way towards the most likely root causes, those fundamental issues that, when addressed, will resolve the main problem.
Steps to Create an Ishikawa Diagram
Using the Ishikawa diagram is a collaborative and iterative process. Here’s a step-by-step guide to creating and using the diagram:
Define the Problem: Start by clearly defining the problem you’re facing. Be as specific as possible. For example, instead of saying “we have failed product quality,” try “The product dimensions are incorrect in 3 out of 10 production batches.”
Draw the Fishbone Diagram: Draw a horizontal line (the “spine”) with an arrow at the right side to represent the problem. Branch off the spine with lines (the “bones”) to represent each of the main categories.
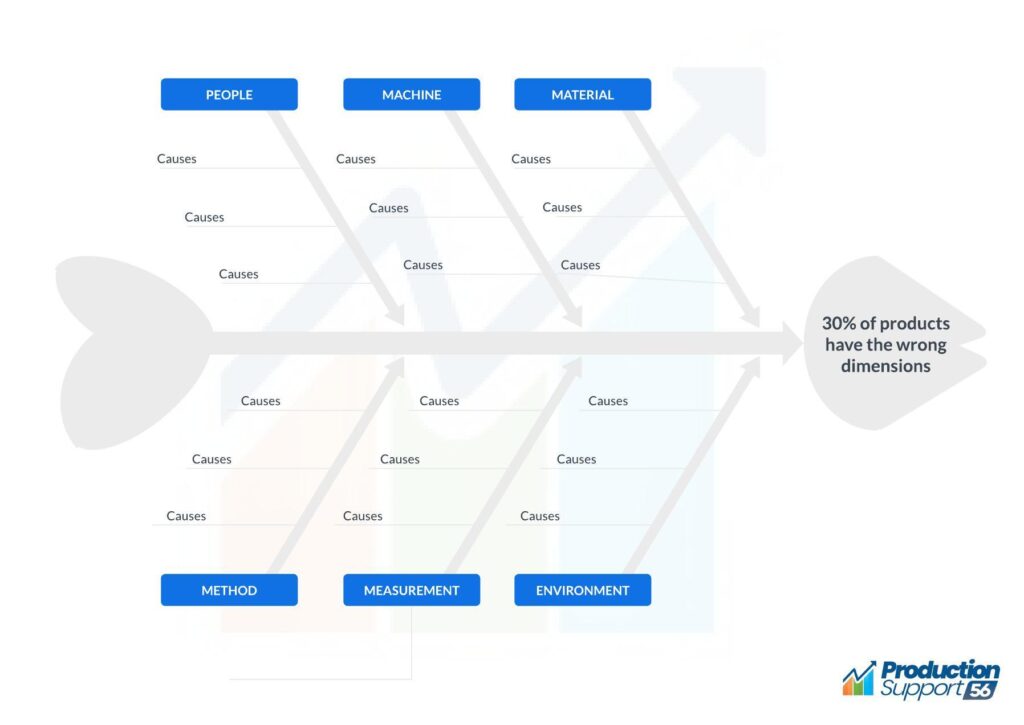
Identify Major Categories: List the categories of causes. If you’re using the traditional six categories (People, Machine, Material, Method, Measurement, Environment), label the bones accordingly. In some cases, you might want to tailor these categories to suit the specific problem.

Brainstorm Causes: For each category, brainstorm potential causes of the problem with your team. Use open-ended questions like:
- What issues might we have with our people, training, or staffing?
- Is our equipment outdated or malfunctioning?
- Are there issues with the materials we’re using?
- Are our processes optimised, or are there inefficiencies?
- Are our measurements or data collection methods accurate?
Identify Sub-Causes: Break down the major causes into smaller, more specific issues. Keep asking “why” to dig deeper into each cause. For example, if you identified a problem with “training” under the “Man” category, you might explore sub-causes like “insufficient onboarding” or “lack of refresher courses.”
Analyse and Prioritise: Once you have a comprehensive list of potential causes, analyse which ones are most likely contributing to the problem. Look for patterns or areas that seem to have the greatest impact. This is where you focus your attention to address the root causes.
Develop Action Plan: Once the root causes are identified, develop a strategy to address them. This might involve process changes, training, equipment upgrades, or more focused problem-solving in a specific area.
Why the Ishikawa Method Works
The Ishikawa diagram is more than just a brainstorming tool—it’s a way to structure your thinking and identify deeper patterns. Here are a few reasons why it’s so effective:
Visual Clarity: The diagram’s visual nature helps simplify complex problems by breaking them down into clear categories and causes. It serves as a roadmap that everyone involved in the process can follow.
Collaboration: By involving a diverse team in the brainstorming process, you bring different perspectives to the table. This often uncovers causes that might have been overlooked if only one person was analysing the problem.
Holistic Problem Solving: By addressing a variety of potential causes, the Ishikawa diagram promotes a comprehensive understanding of the problem. It helps avoid the “symptom-focused” approach that only treats surface-level issues.
Structured Thinking: The categories and sub-categories help you think about the problem from multiple angles. It prevents you from focusing too narrowly on one aspect of the issue, ensuring that all potential causes are explored.
An Example of Ishikawa in Action
Let’s say your company is facing a high rate of product defects in its final output. Here’s how you might use the Ishikawa diagram to analyse the problem:
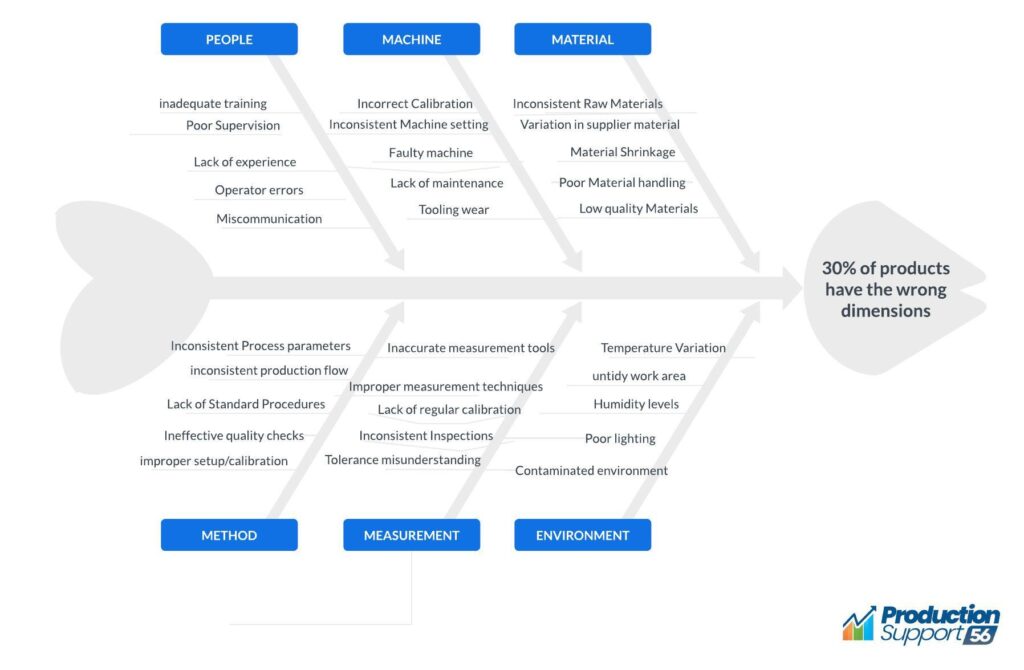
Remember to clearly define the problem as precise as you able to. For example, 30% of the finished products have the wrong dimensions.

People
- Inadequate Training: Operators or technicians may not be properly trained in dimensional measurement, machine setup, or handling techniques, leading to mistakes.
- Lack of Experience: Inexperienced workers may not recognise when something is off or may misinterpret dimensional tolerances, causing defects.
- Operator Errors: Mistakes in measuring, setting up machines, or adjusting equipment could lead to incorrect dimensions.
- Miscommunication: Poor communication between teams (e.g., between design and production) might result in misunderstanding of dimensional specifications.
- Poor Supervision: Supervisors may not be actively verifying the setup or checking the products for dimensional accuracy.
Machine (Equipment):
- Incorrect Machine Calibration: Machines may not be properly calibrated, leading to inaccuracies in dimensions.
- Outdated or Faulty Machines: Older equipment or machines with worn-out parts may produce inconsistent results, affecting dimensions.
- Machine Wear and Tear: Regular wear on machine parts (e.g., molds, dies, cutting tools) can lead to dimensional variations in products.
- Lack of Preventive Maintenance: Machines that are not regularly maintained can lead to breakdowns or suboptimal performance, affecting the precision of the final product.
- Inconsistent Machine Settings: Changes in machine settings, either intentionally or unintentionally, can cause dimension discrepancies across batches.
Material:
- Inconsistent Raw Materials: Variations in material properties (e.g., composition, size, or quality) can result in dimensional inconsistencies.
- Material Shrinkage/Expansion: Certain materials (especially metals, plastics, or composites) can expand or contract during processing, leading to dimensional changes.
- Poor Material Handling: Improper handling or storage of materials (e.g., deformation, contamination, or moisture absorption) can cause dimensional issues.
- Quality of Material: Using low-quality raw materials can cause irregularities in the final product dimensions.
- Variation in Supplier Materials: Different batches of materials from the same supplier may have slight variations in properties that affect product dimensions
Method (Production Processes):
- Inconsistent Process Parameters: Variations in process parameters such as speed, temperature, or pressure across batches could affect the final dimensions
- Lack of Standard Operating Procedures (SOPs): Absence of clear, standardised procedures for machine setup, production, and quality control could lead to inconsistency in dimensions.
- Improper Setup/Calibration: Machines may not be set up correctly at the beginning of each batch, or calibration may not be regularly performed.
- Inconsistent Production Flow: Bottlenecks or inefficiencies in the production line can create rushed conditions, which lead to dimensional errors.
- Ineffective Quality Checks: If quality checks are not consistently performed at key stages or if they are not thorough enough, dimensional errors may not be caught until later in the process.
Measurement:
- Inaccurate Measurement Tools: Measurement tools such as calipers, micrometers, or gauges may be inaccurate or poorly calibrated, leading to incorrect dimensional readings.
- Improper Measurement Techniques: Workers may use incorrect methods to measure product dimensions, leading to inconsistent results.
- Lack of Regular Calibration: Measuring instruments that are not calibrated regularly could provide inaccurate measurements, leading to errors in dimensions.
- Inconsistent Inspection Process: If inspections are not conducted consistently across all batches or at the correct stages of production, dimensional issues may go undetected.
- Tolerance Misunderstanding: If workers or inspectors do not fully understand the acceptable tolerance levels for the dimensions, they may incorrectly assess whether the product is within specification.
Environment:
- Temperature Variations: Fluctuations in factory temperature can lead to expansion or contraction of materials during production, affecting their dimensions.
- Humidity Levels: High or low humidity can affect materials (especially wood, plastics, or certain metals), causing dimensional changes.
- Dirty or Contaminated Environment: Dust, dirt, or contaminants in the work environment may interfere with machinery calibration, measurement tools, or the materials themselves.
- Poor Lighting: Inadequate lighting may hinder people from seeing measurement details clearly, leading to errors in dimensioning.
- Disorganised work place: A untidy ir disorganised workplace could lead to distractions or mistakes during the production process, affecting dimensional accuracy.
Here is what the Fishbone diagram would look

By systematically exploring these categories, you can identify the real cause of defects—whether it’s a training issue, machine malfunction, or materials problem—and take corrective action.
An Action plan for this example may include some or all of the following,
People:
- Provide comprehensive training for operators, including correct measurement techniques, machine setup procedures, and dimensional specifications.
- Develop clear and detailed work instructions for machine setups, production steps, and quality control checks to ensure consistent processes.
- Ensure proper supervision and real-time monitoring during production to detect and correct dimensional issues early.
- Improve communication between design, production, and quality teams to ensure everyone understands the exact dimensional specifications and tolerances.
Machines:
- Implement a preventive maintenance schedule to keep machines in good working condition and prevent wear-related dimensional issues.
- Ensure that all machines are calibrated regularly and that operators are trained to set up machines properly at the beginning of each batch.
- Regularly inspect and replace tooling (e.g., molds, dies, cutting tools) to prevent wear and ensure consistency in product dimensions.
- Invest in upgrading old or outdated machines that are prone to dimensional inaccuracies.
Materials:
- Ensure that raw materials meet specified standards and undergo inspections before use in production.
- Improve the handling, storage, and transportation of materials to prevent damage or contamination.
- Work closely with suppliers to ensure material consistency across batches and develop quality agreements to minimise variation.
Process:
- Standardise machine setups, process parameters (temperature, pressure, etc.), and production flow to eliminate variability between batches.
- Establish strict machine calibration procedures and schedules to ensure machines are always properly set up for accurate production.
- Implement regular, systematic inspections at key stages of production to catch dimensional errors early, before products are completed.
- Ensure that production workflows are optimised and well-organised, minimising delays and the risk of rushing.
Measurement:
- Regularly check and calibrate measuring instruments (micrometers, calipers, etc.) to ensure accurate readings.
- Train workers on the correct use of measurement tools and ensure they follow proper techniques to avoid errors.
- Perform consistent inspections using the same tools and methods, and ensure all inspectors are aligned on dimensional tolerances.
- Make sure that dimensional tolerances are clearly communicated to all production and quality control staff, and ensure consistent understanding and interpretation.
Environment:
- Monitor and control factory temperature and humidity levels to prevent material expansion or contraction during production.
- Ensure that all production and inspection areas have adequate lighting to allow for precise measurement and quality checks.
- Maintain a clean work environment to reduce the risk of contamination affecting machinery, materials, and measurement accuracy.
Conclusion: The Power of the Ishikawa Problem-Solving Method
The Ishikawa problem-solving method is a powerful tool that helps teams uncover the underlying causes of problems. Its simplicity, versatility, and focus on root cause analysis make it an essential technique in the toolbox of quality management.
Whether you’re improving quality in a manufacturing process, resolving customer complaints, or addressing inefficiencies in a service, the Fishbone Diagram helps you uncover the underlying factors that contribute to the problem.
By following a structured, visual process, teams can collaborate effectively, identify key causes, and develop targeted solutions that have a lasting impact. So, the next time you’re faced with a challenging problem, remember the Ishikawa method—it’s a powerful way to get to the heart of the issue and solve it for good.
Find out more about how to implement structured problem solving or other process improvement tools into your organisation by getting in touch with our Process Improvement team.

