Simulation stories are a series of articles about modelling some of the more interesting anomalies we have come across in manufacturing. The articles will cover the who, what, how and why, of modelling highly skilled operators.
Modelling highly skilled activities
John was an expert, the best in the business. All was ready. His knife was sharp, and crates of fish were by his side, the next fish always in easy reach. When he started he moved with precision, every move flowed into the next, there was no wasted effort. He smoothly cut away the fish’s head and was already reaching for the next one before the head had hit the bin. The man was the fastest, he could dehead a trout in 25 seconds. That included picking up a new fish, deheading, and moving the headless fish on to the next process.
The next best was the owner. He was brought up in the factory when his dad ran the business. As a student he had worked the line during the summer, weekends and on the run up to Christmas. He knew every job intimately and even now as the owner worked the line when needed. The best he could do was 55 seconds, but he could only keep that pace for an hour.
John could go all day at 1 fish every 25 seconds. The problem was that the rest of the line could not keep up, and by the first break the filleters were shouting for him to slow down. This was fine by John, he got an extra ten minutes break to enjoy his cup of tea and chocolate digestive whilst the rest of the team caught up.
When John was away for a week in the lake district with his wife and dog, the factory had to put two people on the deheading station. And even then, they weren’t as quick as John, and the whole line had to be rebalanced.
Mathematically describing the experts
This was an interesting scenario to model. Normally you would measure a series of times taken to carry out the activity by a variety of operators, and use a mathematical description to describe the variation. If you have enough data, you could fit it to a mathematical description, for example a normal distribution with a known sample mean and standard deviation. If you only have the range of times, you could use a triangular distribution. If you were modelling using a spreadsheet you would just use an average.
In the case of the fish processing plant, understanding the relationship between the operator’s skill levels and the throughput was critical. So, a simple distribution to cover all skill levels in a role was not sufficient. Modelling highly skilled deheading activity required us to create two skill levels, there was John and there was a normal skill level. We also found that there was a significant difference in trimming skills, and so created an expert and normal skill level for this activity too.
In other roles, like pin boning, there was a difference in cycle time between the experienced and less experienced staff. However, the difference was not significant and there were always more than four pin boners working at any one time, so a normal distribution was sufficient to describe the speed of all pin boning staff. For those of you who don’t work in fish processing- the pin boners job was to remove the tiny bones left in the fish fillet. This role is critical as the automated pin boning machine is not 100% effective. In fact, the effectiveness of the machine depends on a range of factors: the species of fish, temperature of the fillet, time of year the fish was caught, the size of the fish, and ambient temperature. The effectiveness of the pin boning machine was very difficult to predict, so this made staff planning very difficult.
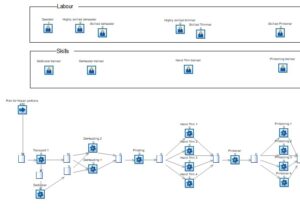
Figure 1. Model logic for the start of a fish processing line, using two different skill levels for deheading and trimming.
Recording cycle times
When collecting cycle time data, it is important to define the beginning and end of the activity. An activity often starts when an item is first picked up and ends when the finished part has been passed on to the next step. It is easy to fall into the trap of only recording the time of the main activity and ignoring all the waiting, movement and transport. When you are defining an activity you need to make sure its boundaries meet with the previous and next activities. It is easy to either double account for actions or leave gaps between activities.
In the fish deheading activity the previous action was the transport of a case of fish to the deheading station process, here the fish waited in a queue for the deheading activity to be available. The deheading activity starts when a fish from the queue is picked up. The fish is then deheaded, the head dropped in a bin, and finished when the deheaded fish is moved to the filleting machine queue.
Once you have collected the cycle time data it is time to start building your model.
Modelling different skilled personnel in Simul8
At Production Support 56 we use Simul8 simulation software to build our manufacturing models. The functionality for modelling different skilled individuals and prioritise different staff roles for an activity is already built-in, so modelling a range of skilled operator levels is quick and easy.
- First, you create two resources. They represent the two different skill levels. You can define the number of people with those skill levels in the ‘Resource Properties’ dialog box. However, in our example we used ‘Resource Schedule’ as we wanted to model break times.

Figure 2. Defining labour types.
- You then connect the two skilled resources to a ‘Pool Resource’. Here you define which resource has priority for the activity, and how long each type of resource takes to complete the activity. In our model we were using minutes as the time unit, and so 25 seconds had to be converted to decimal-minutes (0.41 minutes).
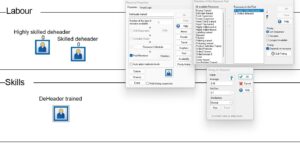
Figure 3. Defining pool resource and different labour’s activity times.
- Finally, you connect the Pool Resource to the activity using the resource. When we were running different scenarios, we changed the number of highly skilled deheaders and skilled deheaders in the ‘Resource Schedule’.

Figure 4. Connecting pool resource to activity
Fish processing line simulation overview
This simulation project was commissioned with the aim of identifying the best way to improve the resilience of the production line. The business had already identified that the throughput of the line was dependant on the presence of a small number of key staff. The model was to look at resilience of the line versus staff skill matrix.
Once the simulation project was defined, we set about collecting the data. We mapped the production line, identifying product and information flow, batch sizes and equipment performance. Working with the supervisor we defined the shift and break patterns, the different staff roles, which roles carried out (or covered) each activity. Then came the tricky part, measuring the cycle time for each activity for a range of different skill levels. It is well known that operators tend to work faster when time and motion studies are taking place. So, we took the approach of being more interested in technique and quality of each activity. We believe this gave us more accurate data and had the benefit of providing information for training packs for each activity.
With this information we were able to construct a draft model. We analysed the cycle time data so we could mathematically describe the variation for each activity. If there was significant difference in cycle times between skill levels we then modelled highly skilled labour separately. We validated the draft model with the supervisor, paying particular attention to build-up of work in progress and throughputs. He confirmed the flow of materials and production rates, and we needed a little tweaking to some of the batching processes.
With the verified model we ran a series of simulation scenarios with different skill mixes. This identified four staff that impacted throughput when absent. This was mainly due to poorly skilled staff covering during breaks. Some cross training of operators and changes to the break pattern mitigated the majority of the throughput losses. However, the model did identify a perfect storm when two specific staff were off at the same time. To mitigate this a significant amount of cross training was required, and operationally it was just easier to ensure the two operators did not book annual leave at the same time.
These recommendations were implemented, and the business saw more consistent throughput throughout the year, especially over the summer season when staff liked to take long holidays.
How do I get started with Simulation?
If you work in Manufacturing and are interested in learning more about simulation then take a read of ‘Why is Simulation such a useful tool for Manufacturers’ or take a look at ‘Simulation for Improvement’. If you think simulation could help your business, then get in touch and we’ll arrange a video call to help you get started.
Image by Akbar Nemati from Pixabay